Summary
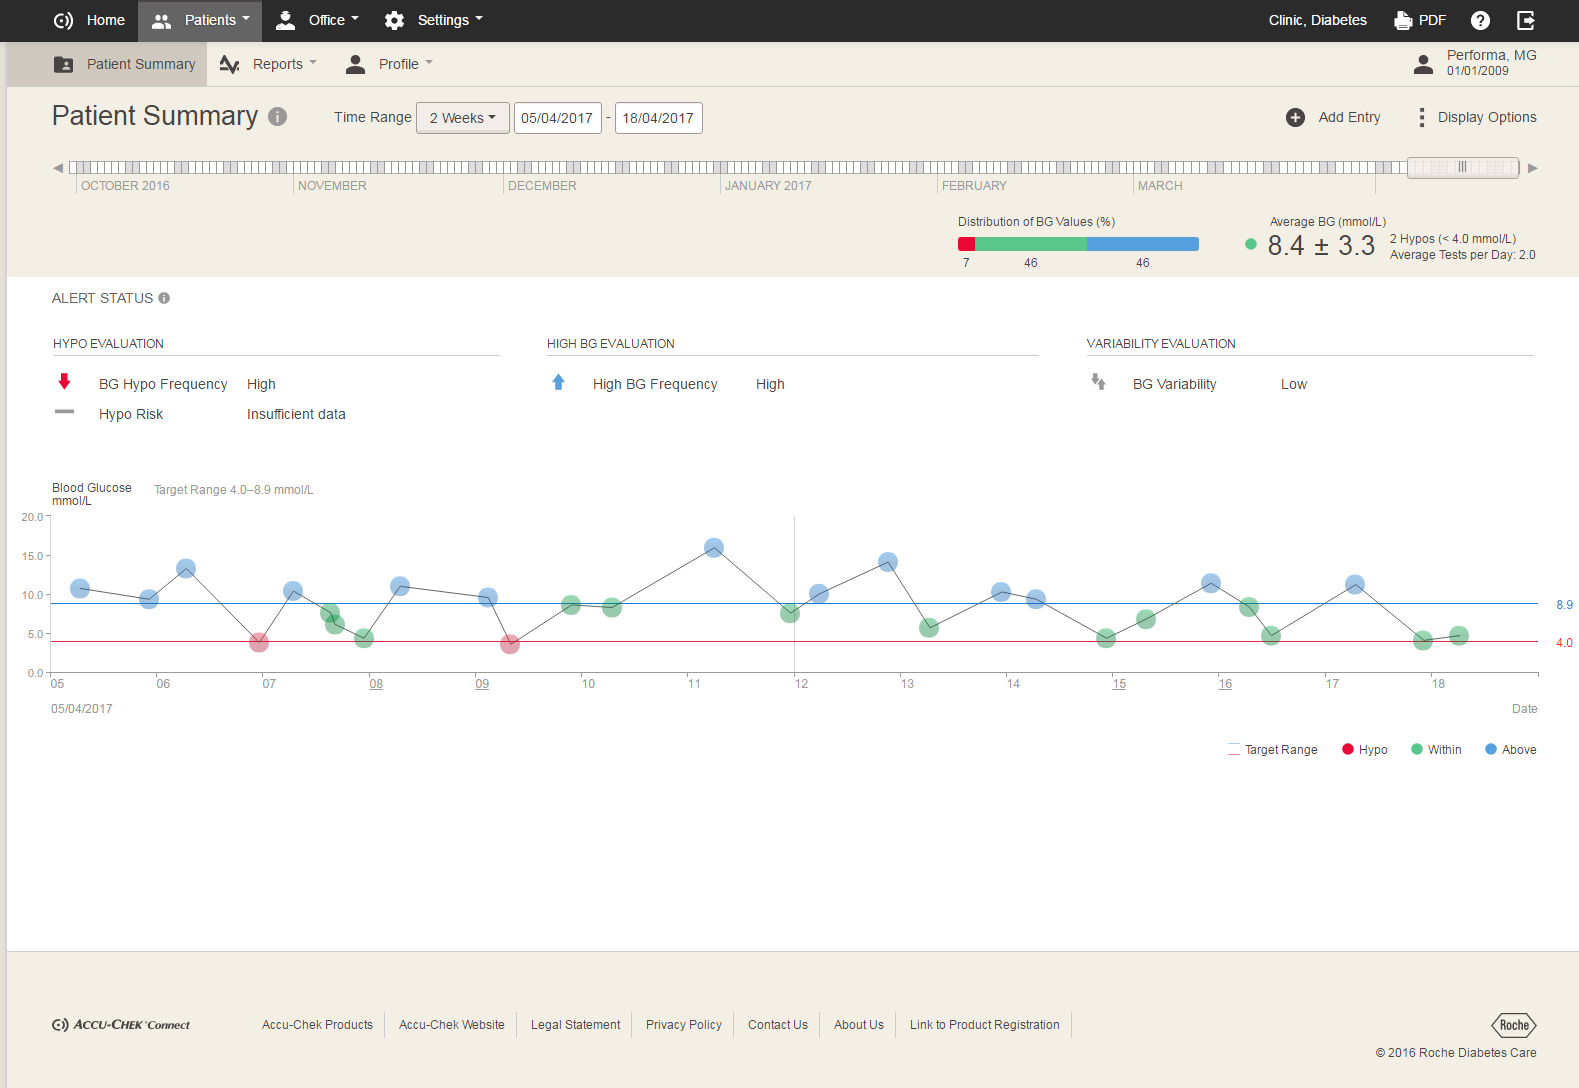
The Summary screen is a good starting point for your blood glucose assessment. It includes a Standard Day graph that shows your blood glucose data in a 24-hour overview over the last few weeks along with important statistical information on hypoglycaemic events as well as average blood glucose results. The glucose results and statistics are color-coded so it is easy to focus on patterns that require further attention.